Connect with us

Reports

Payoneer Report Finds 91% Indian Sellers Aim To Expand Their Business Globally

Published

on

payoneer

Payoneer Report Finds 91% Indian Sellers Aim To Expand Their Business Globally

Payoneer (NASDAQ: PAYO), a commerce and technology company powering payments and growth for the new global economy, today launched the first edition of its India eCommerce Report, Made in India for the World: The State of Indian Cross-Border eCommerce.’ This report is based on responses to an extensive survey conducted among cross-border commerce businesses associated with Payoneer in India. The report highlights factors that have helped Indian cross-border sellers succeed so far and challenges that need to be overcome. As per the findings, Indian sellers have moved on from the pandemic and have made healthy progress in this space. Interestingly, 86% of Indian sellers saw an increase in earnings since the start of the pandemic.


Many Indian cross-border businesses have undergone a fast-paced digital transformation and contributed to surpassing the government-set $400 billion export target this year. This was possible partly due to the ‘Make in India’ program and shifting customer demands around the world. Interestingly, the report mentions that 91% of Indian sellers are looking at expanding their business to new markets, with 73% eyeing the United States for their planned cross-border trade expansion.

“Having recently crossed its ambitious export target of $400 billion, India has made a significant mark in today’s cross-border trade ecosystem. With the support of the government throughout the challenging pandemic years, most Indian sellers have reported an increase in their earnings,” said Gaurav Shisodia, Country Manager (India) at Payoneer. “The findings of our India eCommerce Report 2022 give us an understanding of the current state of India’s cross-border sellers and reinforce our belief that Indian sellers will continue to grow exponentially in the global market.


At Payoneer, our mission is to constantly provide a seamless experience and empower our customers to reach greater heights,” he added.

Indian seller ecosystem: key strengths & challenges

As growing connectivity brought a boom to borderless economies, Indian sellers saw increased interest from across the globe, largely owing to the quality of ‘Made in India’ products. As per the report, 70% of Indian sellers established that it is their faith in their product quality as compared to that of other leading countries that is helping them expand their exports on an international level. On being asked about the key challenges that they face in the ecosystem, 35% of Indian sellers stated marketing as their biggest weakness when it comes to selling their products, while 28% reported supply chain issues as the key challenge. Some sellers also mentioned how there is a common myth that Indian goods are low in quality and lack innovation, leading to issues for sellers in building trust and credibility amongst foreign buyers.

ePayment platforms are the key drivers behind the optimism of Indian sellers

With more and more businesses going global, ePayment platforms are getting increasingly popular for international transactions, as 66% of the respondents said online payment solutions are the most preferred cross-border payment method. The respondents also added that apart from ePayment platforms, factors such as government support and improved logistics are also major contributors to their optimism around future trade earnings.

The increased confidence of Indian sellers owing to quality products at competitive pricing has had a positive impact on cross-border eCommerce. The report states that 93% of respondents have confirmed their optimism about their future trade earnings.

Here is the link to the report – Payoneer India eCommerce Report

About Payoneer
Payoneer (NASDAQ: PAYO) is the worlds go-to partner for digital commerce, everywhere. From borderless payments to boundless growth, Payoneer promises any business, in any market, the technology, connections and confidence to participate and flourish in the new global economy.

Since 2005, Payoneer has been imagining and engineering a truly global ecosystem so the entire world can realize its potential. Powering growth for customers ranging from aspiring entrepreneurs in emerging markets to the worlds leading digital brands like Airbnb, Amazon, Google, Upwork and Walmart, Payoneer offers a universe of opportunities, open to you. www.payoneer.com

Continue Reading
Advertisement

Reports

Data Research Reveals The Most Tech-Forward Regions in the UK

Published

on

uk top tech forward regions

Many businesses are currently concerned with the slower rate of economic growth, traditionally slow levels of growth come with recession rumours and sometimes a starker reality.

Despite lower levels of growth in some industries, across the UK the tech industry is outpacing other sectors when it comes to growth. In fact, it’s expanding over two and a half times faster than the rest of the UK’s economy, with newly registered tech companies appearing at an average rate of 22%.  By inspecting this highly competitive industry, it’s clear to see that certain regions seem to be attracting higher levels of tech professionals and providing optimal environments for tech firms to thrive.

So just what is it that contributes to a flourishing tech company? Microsoft Partners, Pragmatiq have carried out a data study to better understand the contributing factors that ensure tech firms thrive.

The League of Tech-Savvy Regions

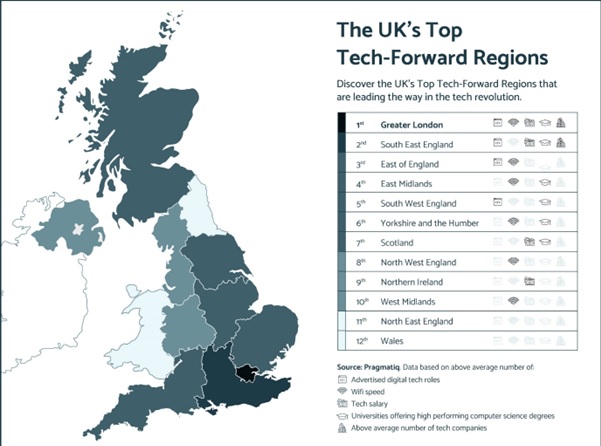
Using data collected and measured against varying criteria, each region has been ranked via a points system to distinguish innovation hub locations from regions with less focus on tech. To generate this data set the following criteria has been considered; the number of tech jobs advertised in an area, the average Wi-Fi speed, the average tech salary, the number of universities offering computer science degrees and of course the number of tech companies based in the region. Full details of the methodology used can be found at the end of this article.

The Winners

  1. Greater London
  2. South East England
  3. East of England
  4. East Midlands
  5. South West England
  6. Yorkshire and the Humber
  7. Scotland
  8. North West England
  9. Northern Ireland
  10. West Midlands
  11. North East England
  12. Wales

Greater London: An Obvious Winner

As the capital city of the UK with a reputation for being one of the world’s leading financial powerhouse cities, it’s no surprise that Greater London ranked at the top of the leaderboard. Scoring points across every single leaderboard category, above average for; salaries, tech jobs, wifi speed, high-performing universities and tech companies.

Unsurprisingly London is a popular location with many FTSE100 companies and disruptive start-ups alike. With capital’s workforce made up of almost 2.2 million millennials and Gen Zers who are considered digital natives, these combined factors are likely to drive up results.

When it comes to tech roles, London does offer the best salaries going when it comes to tech roles. The average tech salary sits at £55,000, around £17,500 more than a tech role based in South East England. Of course, this also considers London weighting, but it’s still over £16,000 more than the second-highest placing region for tech salaries (Northern Ireland).

The Second Most Tech-Savvy Region

South East England came out as another top scorer, achieving four out of a possible five points and putting two points between themselves and the third-place spot. As an area that offers exceptional job prospects within the tech industry, above average salaries, excellent universities offering Computer Science degrees and also around 4,812 tech companies, the South East is a clear contender for the most tech-savvy region.

The region is also an admirable area for study, especially where undergraduates are concerned. The region houses six high-scoring universities that offer a Computer Science degree, one of which (University of Oxford) sits within the Russell Group. Russell Group universities are notorious for their social, economic and cultural impacts, something the city of Oxford has benefited from in recent years. As well as presenting a TCU rating of 99%, the university also encouraged 21 spinout tech firms alone in the year 2017.

The South East region lost a point on WiFi speed by just 0.4Mbps where 72Mbps came out as the average. Less emphasis on budget for improved telecommunications is likely where the region has fallen short. According to one study on non-domestic premises, only 26.81%of businesses had full fibre installed, meaning many missing out on faster connection speeds without it.

Otherwise, it’s deemed a technology hub with above-average access to digital roles, good salaries, and number of registered tech companies.  South East England is also in close proximity to London, making it ideal for businesses to operate out of the area without the extortionate price tag for rent or expenditure on salaries.

As part of the study, many expected the North East to come a close second to Greater London, especially as it has links to Manchester. In recent years, there has been greater interest in operating from Manchester, with companies such as the BBC, Google and Microsoft setting up bases there. This clearly shows that, whilst the interest and development are there, it’s not quite reaching top tech status as a region.

The Runners Up (in Joint Third Place)

  • East of England
  • East Midlands
  • South West England
  • Yorkshire and the Humber
  • Scotland

Five regions were positioned in joint third place with 2 points each. With the exception of Scotland, they all ranked below average for tech salaries where the overall average pay appears at £37,342. Areas, like Greater London, were naturally going to outrank other regions here where the London weighting is considered. It’s worth noting that Glasgow is one of the most popular locations for millennials and Gen Z to live, which positively reflects in the average salary, along with the number of Universities offering quality Computer Science degrees.

Despite the promising figures around educational opportunities and a young force workforce, there are fewer job prospects the further north you head, which attributes to their lower score.

The South West region also finished in joint third place, despite average tech salaries placing at around £35,500, this is still a significant £1,842 shy of the UK average.  In 2022, there was a 57% reported increase in the number of students studying tech and engineering courses within the region, which could attribute to a demand for talent.

One of the key elements that this data study has uncovered is that with the exception of Northern Ireland, it appears that the further away from Greater London you travel, sadly the lower the average salary becomes.

Regions Trailing Behind

  • North West England
  • Northern Ireland
  • West Midlands
  • North East England
  • Wales

Landing in last place, Wales was let down by low average WiFi speeds and a lack of tech companies based in the area. The average  WiFi speeds in Wales has a rate of 58.3Mbps with a humble 882 tech companies currently calling Wales home, compared to the staggering 23,901 London-based tech corporations. Despite scoring in last place, Wales does boast three universities that offer good Computer Science degrees, with Cardiff University ensuring a satisfaction rate of 78.8%. It seems many want to attend university in Wales and then pursue job prospects further afield.

In second to last place, the North East didn’t score any points and was let down by low average salaries for the tech sector.  Offering around £32,500 for a tech-based role, £5,000 less than the average in the South East of England. Although let down by salaries, the North East is home to three high-scoring universities that offer sought-after Computer Science degrees. The region also boasts one of the highest proportions of STEM students in the country, making it an attractive hub for potential tech investment. With an influx of tech companies operating from the North East and North West, this is likely to drive up the region’s score in years to come.


A final word on tech regions

Regions, such as Greater London and South East England, are trailblazing when it comes to their tech forward approach and prospects within the industry. With a lot of businesses trickling down into South East England from Greater London, there has clearly been a much greater emphasis to ensure the region’s success. For example, in order to compete with Greater London, South East England has been able to ensure salary and access to digital tech roles are above average, making it an attractive place to work or set up a business.

This study highlights that every region has room to expand its emphasis on tech even further. With only one region (Greater London) scoring on all five criteria, and two regions (North East England and Wales) scoring none, there are clearly steps local councils and organisations can take to improve an area’s tech offering. Over time, it’s expected that places, such as the North East of England and Scotland will creep up the list further, scoring more points for advertised jobs and the number of tech companies.

Data Methodology

Five categories were defined in total. Through data collection, an average score was generated. Any region exceeding the average received one point with a total of five points to score. Below are the averages used to measure the data:

  • – 3,873

To determine the average score of Universities, a few additional steps were taken. Firstly, the most popular degree within the tech industry needed to be determined. By a significant margin, Computer Science came out on top.

After this point, a full list of universities offering a Computer Science degree was sourced from The Complete University Guide. They produced a score out of 100 for each university that measured things like overall student satisfaction and graduate prospects. Each university was then categorised into regions and an average TCU score was determined at 73.2%.

Any universities with a score above 73.2% were then separated and categorised into regions. Another average calculation was completed to reveal that any region with four or more universities scoring above 73.2% would gain a point. For example, Scotland has eight universities that score higher than average, therefore the region received one point.

How many regions scored above average?

  • Number of advertised digital tech role – 4 out 12 regions
  • Average WiFi speed – 6 out of 12 regions
  • Average total salary – 4 out of 12 regions
  • Universities offering a Computer Science degree with above average score – 6 out of 12 regions
  • Number of tech companies – 2 out of 12 regions
Continue Reading

News

According to OSF Digital, Leading Retailers and Brands Step Up Omnichannel Investments, But Majority Still Fall Short

Published

on

According to OSF Digital, Leading Retailers and Brands Step Up Omnichannel Investments, But Majority Still Fall Short

OSF Digital releases its 2022 Omnichannel Retail Index with insights for retailers and brands to accelerate growth

OSF Digital, an award-winning provider of digital transformation services to companies worldwide, announced the release of its 2022 Omnichannel Retail Index (Index) findings. Launched in 2015 by FitForCommerce (now OSF Digital’s strategic consulting division) in partnership with The National Retail Federation (NRF), the Index is widely recognized as the industry’s most comprehensive omnichannel and digital best practice benchmark study.

The 7th annual study found that top-scoring retailers and brands are aggressively increasing adoption rates of omnichannel and digital capabilities, such as optimized content, frictionless checkout, and cross-channel capabilities, to meet rising shopper demands. Despite this, most companies in the Index have implemented less than 61% of best-practice capabilities, sometimes struggling to deliver seamless shopping experiences. 

The highest-ranking company in the Index had implemented 85% of the Index’s designated best practices, which is a significant jump from 2021, when the highest score was 72%. This increase is a sign that digital investments are paying off. Another sign that retailers and brands are prioritizing omnichannel and digital investments is that this year, 12 companies have outperformed last year’s leader with scores ranging from 73%- to 85%.

The Omnichannel Retail Index interactive digital report outlines key findings on the state of omnichannel and digital best practices, offering insights on investment trends and customer demands. Some of the key findings include:

  • The implementation of Buy Online Pick-Up In-Store (BOPIS) curbside pickup has increased significantly, accelerated by the pandemic. BOPIS has become table stakes, offered by 84%; however, the cross-channel experience leaves much to be desired. The adoption of supporting functionalities that enable frictionless experiences has mainly remained flat in the past years, including the ability to schedule pickup times, filter by store availability, etc.
  • 74% of the loyalty programs are based on a typical “earn & burn” approach. Only 49% allow shoppers to redeem points for product discounts, and even fewer allow shoppers to redeem points for “experiences.”
  • From fast fashion to home improvement, sustainability is in focus. 67% promote sustainable products or sustainability programs.

“Retailers and brands have quickly adopted new capabilities driven by the pandemic, but the necessary customer experience continues to evolve,” said Bernardine Wu, Executive Managing Director of Digital Strategy at OSF Digital. “The latest Omnichannel Retail Index provides meaningful and actionable insights to help retailers and brands prioritize investment decisions and focus staff and capital on growth accelerators.”

“The Omnichannel Retail Index is a critical tool to help retailers and brands navigate the market volatility they face today,” said Gerard (Gerry) Szatvanyi, CEO of OSF Digital. “This year’s report shows an enormous opportunity for the industry to meet customer demands and provide a seamless and memorable customer experience. OSF Digital is committed to providing this comprehensive study to serve the industry best.”

The Omnichannel Retail Index takes the pulse of digital commerce and omnichannel retail. The Index examines how 100+ leading U.S. and global retailers and brands perform against 250+ criteria across web, mobile, and in-store capabilities. The Index examines how these companies deliver on the omnichannel promise through detailed and extensive mystery shopping conducted by OSF Digital’s strategy consultants. For the first time, this year’s report also shares consumer research and data by GfK to understand where retailers and brands are delivering or falling short of consumer expectations. Gfk is a consulting service and always-on, AI-powered intelligence platform for the global consumer products industry. Also new this year is the analysis of these companies’ sustainability practices and programs.

To view the full findings, please visit: https://osf.digital/omnichannel-retail-index

About OSF Digital

OSF Digital is a global commerce and digital transformation leader with expertise in connecting technology and strategy to drive business goals. With expert status in B2C and B2B commerce and several Salesforce awards for multi-cloud innovation, OSF Digital seamlessly guides enterprises through their entire digital transformation journey. With customers in various industries around the globe, OSF Digital provides personal attention and the highest level of connection with a local presence throughout North America, Latin America, APAC, and EMEA.

SOURCE OSF Digital

Continue Reading

Fintech

New Data From Adjust Shows Record In-App Revenue Months For Fintech, E-commerce and Gaming in 2021

Published

on

New Data From Adjust Shows Record In-App Revenue Months For Fintech, E-commerce and Gaming in 2021

Adjust’s Mobile App Trends Report shows iOS 14.5+ industry-wide opt-in rates hit 25%, and 30% for gaming

Adjust, a global mobile marketing analytics platform, today released its annual Mobile app trends report, showing that mobile app growth continued to accelerate globally in 2021. After a year of industry changes and pandemic shake-ups, the app ecosystem saw growth in installs and sessions industrywide, with the fintech, e-commerce and gaming verticals emerging as standouts and seeing their highest in-app revenue months on record in 2021, according to Adjust data.

The rollout of Apple’s iOS 14.5 and AppTrackingTransparency (ATT) framework in April 2021 pushed the mobile marketing industry to reassess the way it handles user privacy and tracking. Although early predictions hypothesized industry-wide opt-in rates as low as 5%, Adjust data shows that this figure is actually approximately 25% (having grown from 16% in May 2021), and gaming has hit 30%.

The global report — based on Adjust’s top 2,000 apps and its total dataset of apps tracked — analyzes long-term trends in installs, sessions, time spent in-app, retention, re-attribution rates, and more across the globe. These insights enable developers and marketers to better understand their audience and the state of the app economy.

“Despite the challenges of the past year, the mobile app ecosystem has continued to thrive, demonstrating how robust and adaptable the app marketing industry is,” said Simon “Bobby” Dussart, CEO of Adjust. “In order to meet users where they are, it’s imperative for marketers and UA teams to lean into data-driven strategies to improve retention, and continue to find, attribute, and measure new and existing audiences.”

Additional key takeaways from the report include:

  • Fintech app installs and sessions are increasing globally by 34% and 53% YoY, respectively.
    • Stock trading and crypto apps made up 7% and 2% of all fintech app installs, respectively, but accounted for 17% and 6% of sessions. Crypto apps also had the longest average session length in 2021 at over 15 minutes.
    • Regionally, North America came out on top for installs with a 69% YoY increase in 2021, followed by LATAM (62%), APAC (29%), and EMEA (16%).
    • In-app revenue for fintech apps steadily and consistently trended upward from January 2020 through December 2021, with March 2021 the highest performing month.
  • Mobile e-commerce is stronger than ever with e-commerce app installs growing by 12% YoY in 2021, and November ranking as the top performing month at 20% above the yearly average.
    • The two most notable markets for growth were EMEA and LATAM, which saw 18% and 14% YoY growth, respectively.
    • May 2021 was the biggest year ever tracked by Adjust for e-commerce in-app revenue, which posted a 46% YoY increase in 2021 globally.
    • Marketplace apps saw significantly better retention rates than the rest of the e-commerce vertical, with Day 1 at 27% and Day 30 at 10%, versus 19% and 7% in 2020.
  • Hyper-casual is here to stay, making up the highest share of gaming installs (27%), while action games account for the largest proportion of sessions (30%).
    • Global gaming installs in 2021 increased by 32% YoY, maintaining pandemic-fueled growth from 2020, with H2 outperforming H1 by a further 12%.
    • The growth in installs was consistent across multiple key regions in 2021. LATAM and EMEA saw the highest results, followed by APAC and North America.
    • January 2021 accounted for the highest global in-app revenue month ever recorded by Adjust.
    • Session lengths, sessions per user per day, and time spent in-app all increased in 2021.

Dussart noted that while 2022 will continue to pose challenges, it will be a year of opportunity, with the need and want for apps more pronounced than ever. “Apps not only provide outstanding, globally leading entertainment formats and convenient ways to complete tasks and enhance our daily lives; they solve problems and empower users in markets all around the world,” he said.

For additional findings, download the full report here.

About Adjust

Adjust is the mobile marketing analytics platform trusted by growth-driven marketers around the world, with solutions for measuring and optimizing campaigns and protecting user data. Adjust powers thousands of apps with built-in intelligence and automation, backed by responsive global customer support.

In 2021, Adjust was acquired by AppLovin (Nasdaq: APP), a leading marketing platform providing developers with a powerful, integrated set of solutions to grow their mobile apps.

Continue Reading

Trending

Subscribe to our Free Newsletter

Get Business and Marketing Insights from Experts, only onTimes of Startups!

Your Information will never be shared with any third party